
The best time to plant a tree was twenty years ago.
After a consolidation phase and stimulus measures for the Chinese economy, the Chinese stock market (Chinese Composite Index) is moving up again.
This recent rise offers opportunities for investors who want to enter strategically.
Enough reason to explore the most promising zones and see how you can make the most of them.
1. Monthly Chart: Your Compass for the Long Term
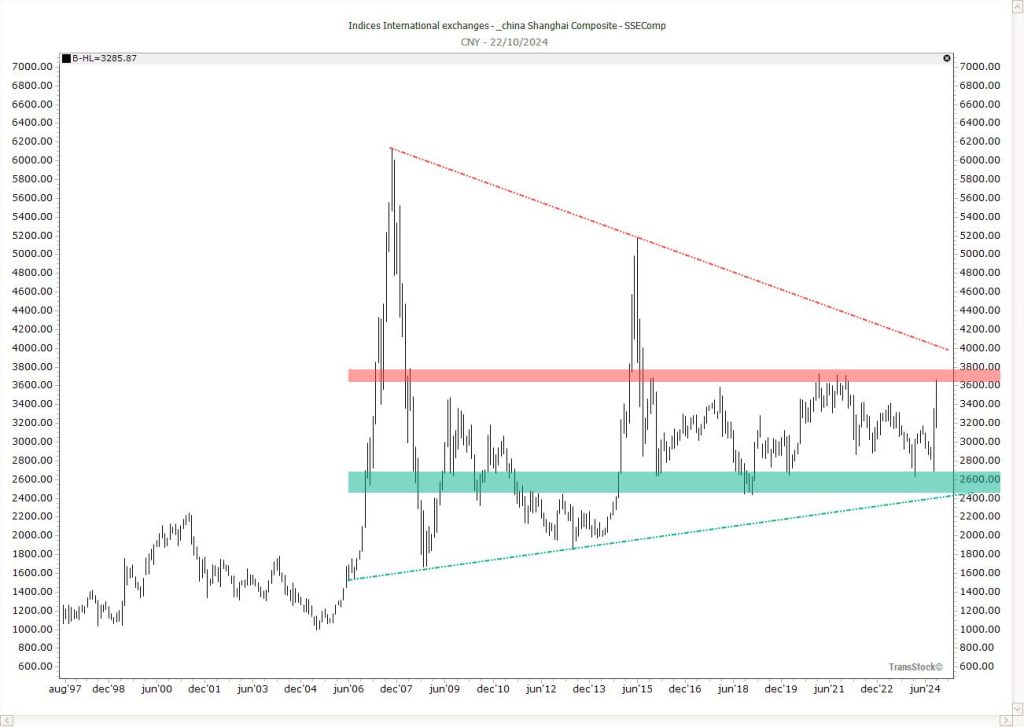
To identify key pivot points, examine the monthly chart, focusing on structural support and resistance levels. As you approach these zones, the likelihood of reversals increases, especially where multiple levels converge. This makes it easy to see where multiple highs and lows converge.
Breakouts of key levels, such as 3700 and later 4000, mark the beginning of a new upward cycle.
Since 2016, the index has been moving sideways within a range of 2600 to 3700 points.
Trendlines clearly indicate where support and resistance are located. Both trendlines approach the same region simultaneously—a breakout opens the door to further growth, with 4000 as the next target.
2. Weekly chart: Accurate analysis for better timing
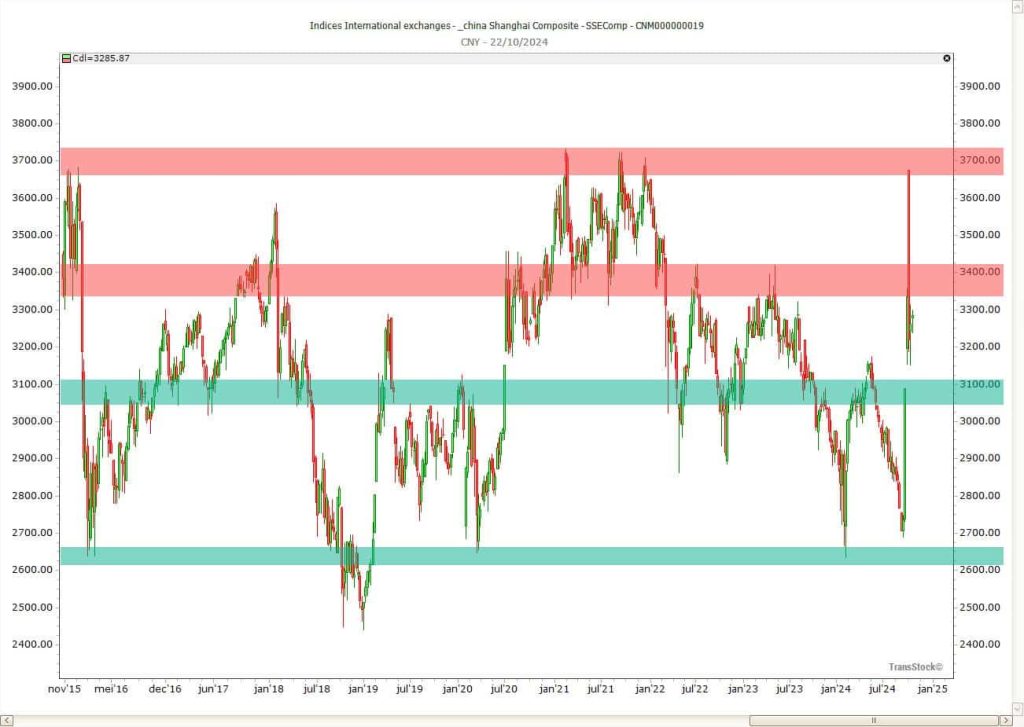
The weekly chart refines the picture: you can more quickly see bounces, retests, and the quality of breakouts. Key zones like 2600, 3100, 3400, and 3700 remain key for assessing risk and potential.
3. Daily chart: The current movement in detail
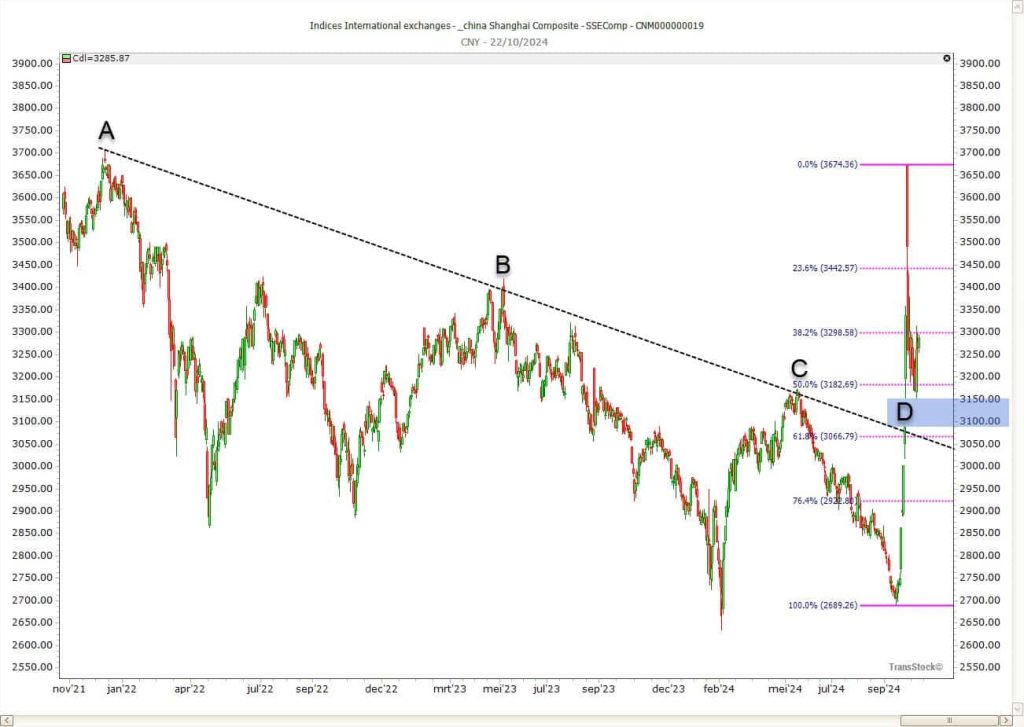
The descending trendline through the peaks has been broken upwards with a gap, confirming momentum. A pullback towards the 3050–3100 cluster zone is normal as long as the upward structure holds. Above the 61,8% retracement, the bias remains positive; several days below this point call for caution.
- Downward trend line broken
If you connect the highs of December 2021 (A) and May 2023 (B), you'll see a descending trendline. This line was recently broken (D).
Point (D) marks the start of a new trend and is therefore an interesting entry point. - Gap/Window: A powerful bullish signal
At the moment of the breakout at point D, you will see a price jump above both the descending trendline and the top of point C. This indicates a strong upward momentum. - Fibonacci levels
The horizontal purple lines are the Fibonacci retracements, measured from the low to the high. The index found support around the 50% level of the Fibonacci retracement. As long as the price remains above the 61,8% level, the uptrend remains intact. - Cluster: The crucial zone
All these factors point to one key zone: 3050/3100. As long as the index remains above this zone, hold your positions. This confirms the positive trend towards 3700 and 4000. A drop below this level for several days is negative. It's best to close your position until a new breakout occurs.
How to get in?
The upward cycle has begun, with price targets of 3700 and 4000 in sight and a stop around the cluster level. Entering with an ETF offers simpler management, broader exposure, and is easier to close below the cluster level. Once the trend is established and there is greater certainty, a switch to individual stocks is possible.
Now follow some interesting options
US listing:
- iShares FTSE China 25 Index Fund (FXI) – This ETF tracks 50 of the largest Chinese companies, with a focus on consumer goods, financials and communications.
- Kraneshares CSI China Internet ETF (KWEB) – Invests in Chinese companies active in internet and technology, including Meituan, Alibaba and Tencent.
- iShares MSCI China Index Fund (MCHI) – This ETF contains more than 600 large and mid-sized Chinese companies.
EU listing (US listing counterparts):
- iShares FTSE China 25 (IE00B02KXK85)
- Kraneshares CSI China Internet UCITS ETF (IE00BFXR7900)
- HSBC MSCI China ETF (IE00B44T3H88)
Ready to see how Snowflake works?
- After this 3-step exploration on a monthly, weekly and daily basis, you will better assess how to benefit from the opportunities offered by the growing Chinese economy;
- You take into account the high volatility of the Chinese stock market;
- The ETFs you trade are based on estimates from the previous and next trading day. This requires patience and strategy.
As an old Chinese saying goes: The best time to plant a tree was twenty years ago. The second-best time is now. Just like investing, it's all about patience and choosing the right moment…
Following the Chinese market without noise?
Use TransStock to see key zones, trend breaks and cluster levels faster — from monthly overview to daily detail.
4,6 / 5
NEWSROOM

Latest video