

Investment Results StockChart – Backtest & Historical Simulations
In unpredictable markets it helps to learning from historical analyses.
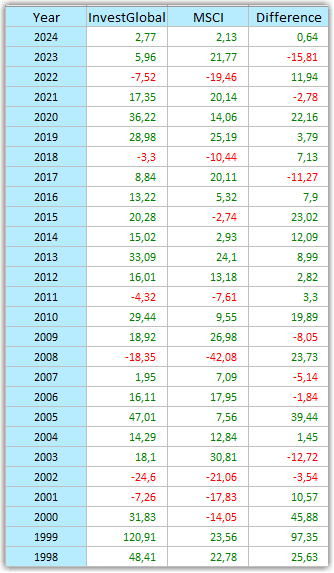
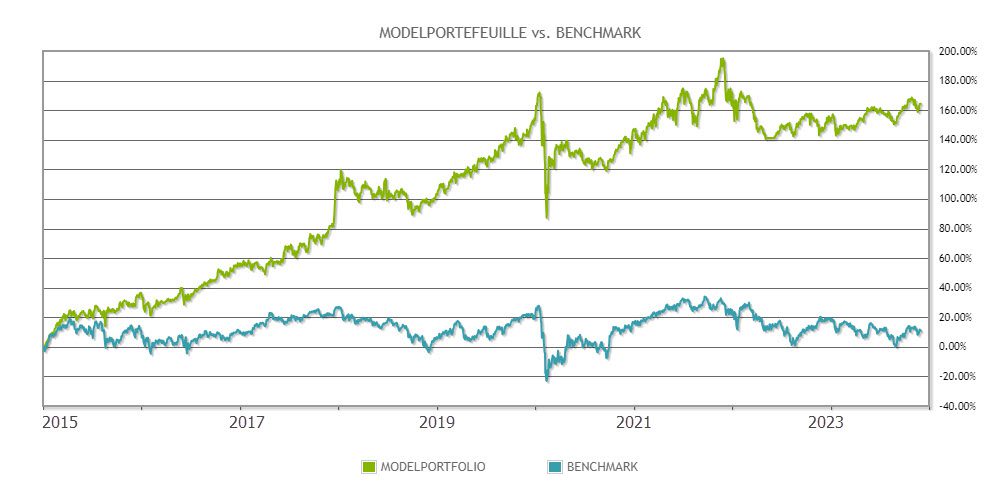
On this page we show the investment results of StockChart in backtest simulations (no real results). You can see how a structured approach might have evolved under different market conditions and how it compares to benchmark indices.

Enhance your investment lifestyle
Thanks to StockChart's automated analysis tools, you can spend less time on market research and more time on what matters to you.

Enhance your investment lifestyle
Embrace the Freedom
StockChart's historical analyses are simulations and do not reflect actual investment results.
They are provided for educational and analytical purposes only and do not constitute investment advice.
What are other investors saying about the results?
Investment Results StockChart: Discover how this solution makes the difference.
Confidence in performance
The historical simulation gave me insight into how the approach works. No guesswork, just clear guidelines based on proven returns.
Patrick, Terneuzen
Peace in my approach
Thanks to the automated signals, I don't have to constantly monitor the market. I know exactly when to act—and when not to.
Chantal, Leuven
Useful comparison
The overview with the MSCI World gave me immediate insight. It's interesting to see how structured investing makes a difference.
Henk, Utrecht
Efficiency + simplicity
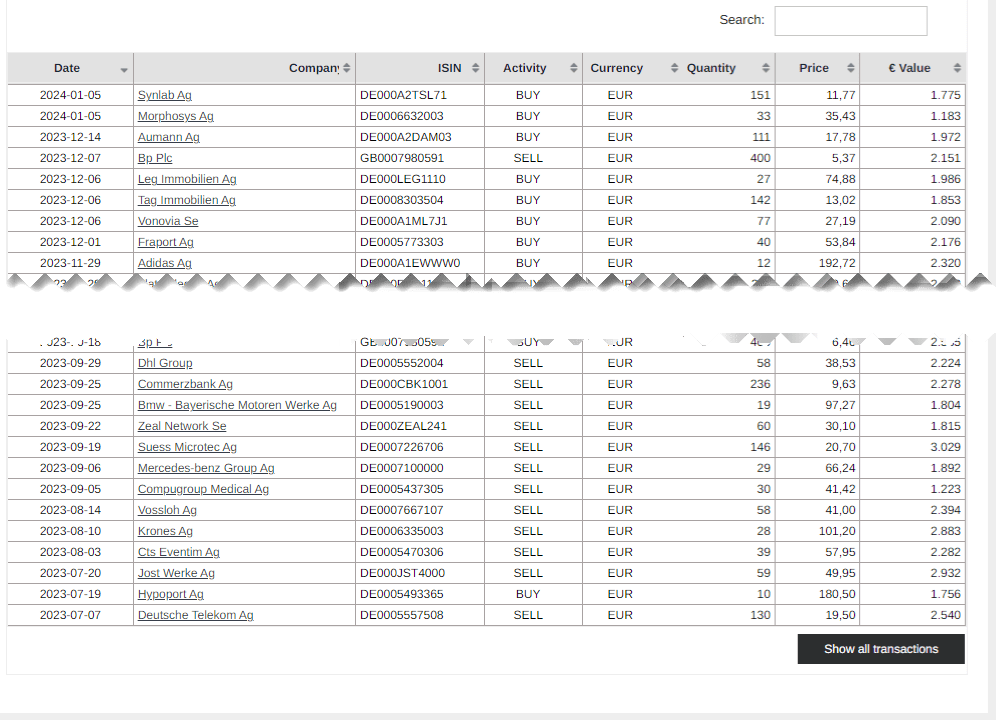
I started with the model portfolio in 2020 and am now also following the backtest portfolio.
The comparison with the index is clear and user-friendly”
Karel, Antwerp