Clear price analysis with Close Candle & Williams Alligator in TransStock

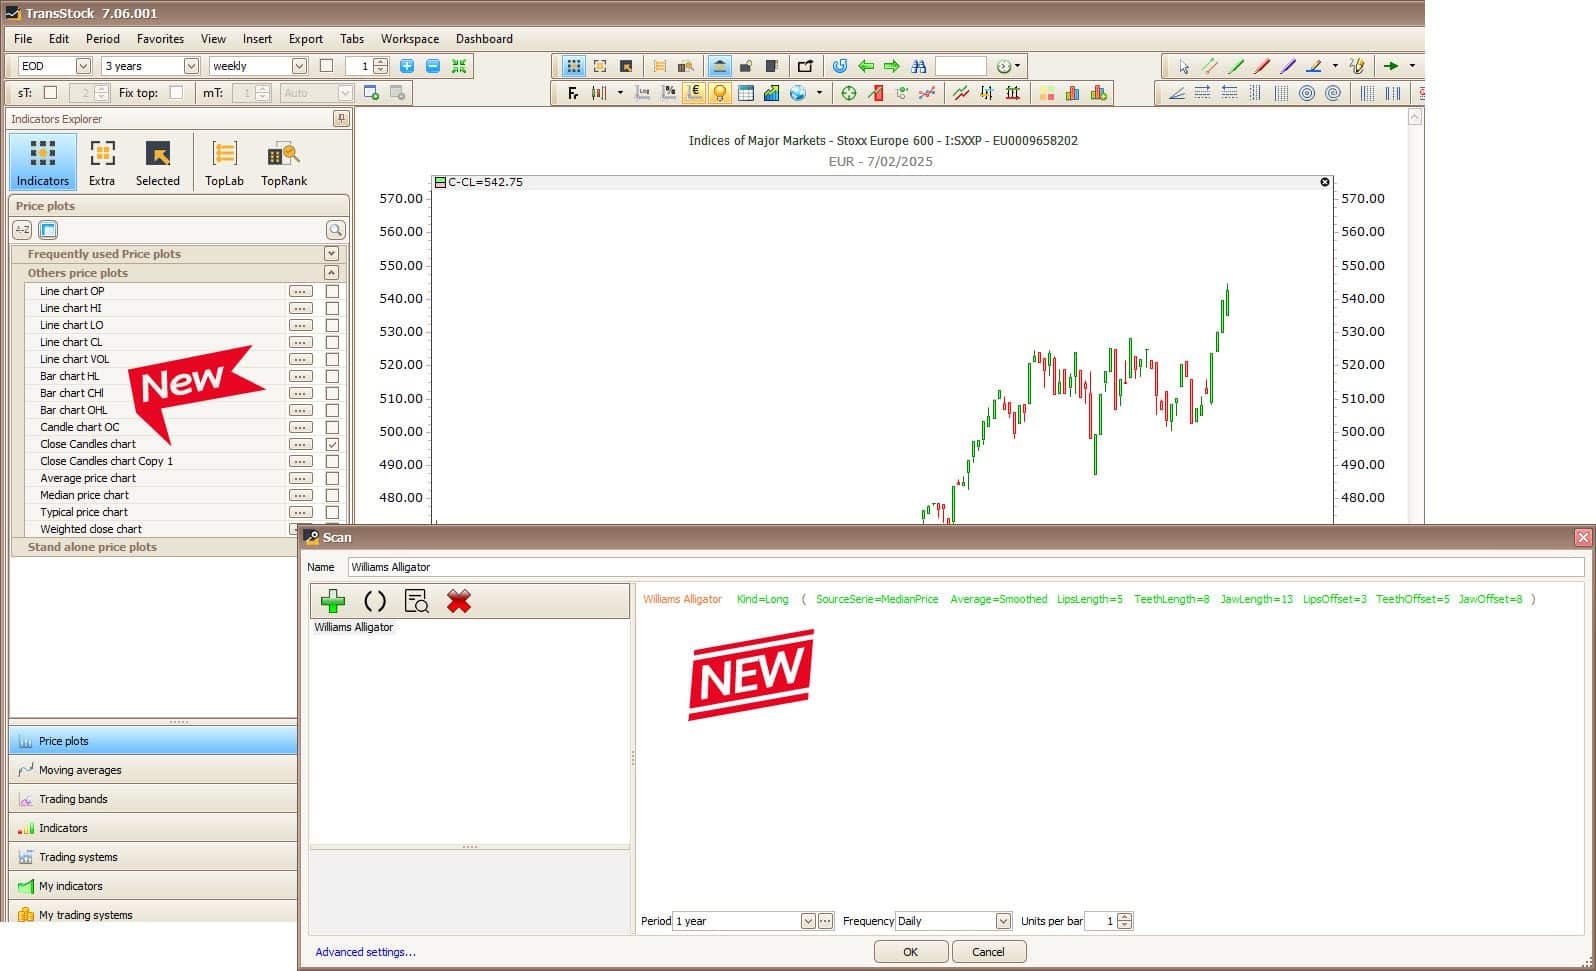


With the release of TransStock (v7.06.001) you will receive two practical additions: the Close Candlestick Chart based on closing prices and the Williams Alligator as a scan filter in TransTrader. Both help you more clearly assess trends and pivot points.
Close Candle Chart: Focusing on Closing Prices
Where can you find this view?
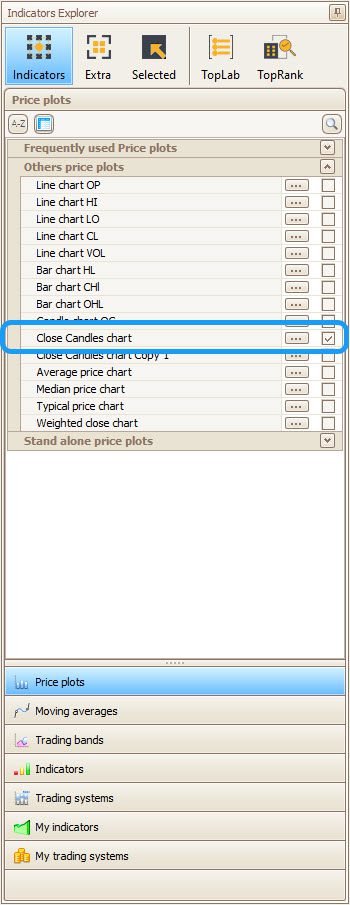
Indicators Explorer → Price Plots → Other Price Plots → Close Candles Chart.
What is the Close Candle?
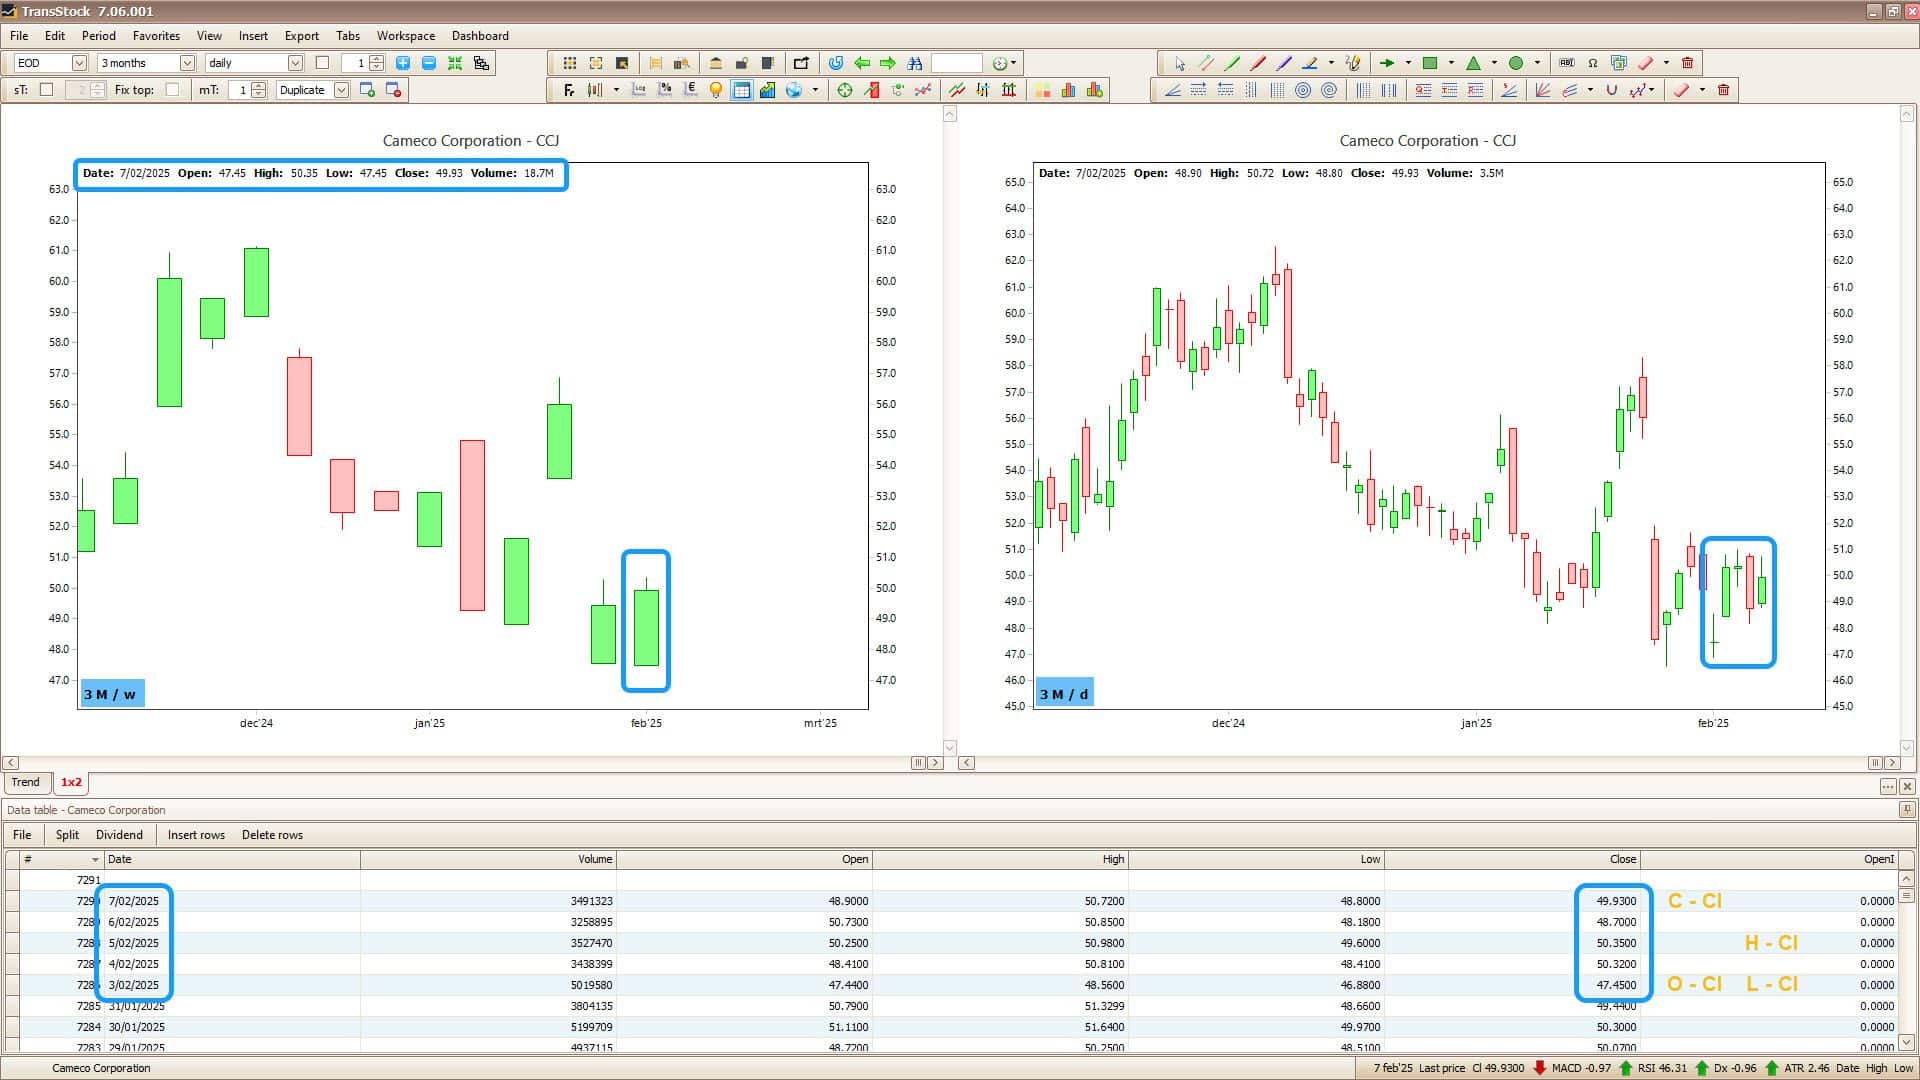
The chart uses only closing prices from the daily OHLCV data.
- On a daily basis you will see one tick (the day close).
- On a weekly/monthly basis (or other aggregation), four closing prices are used: Opening Close (first close), High Close (highest close), Low Close (lowest close) and Final Close (last close) within the period.
Why is this useful?
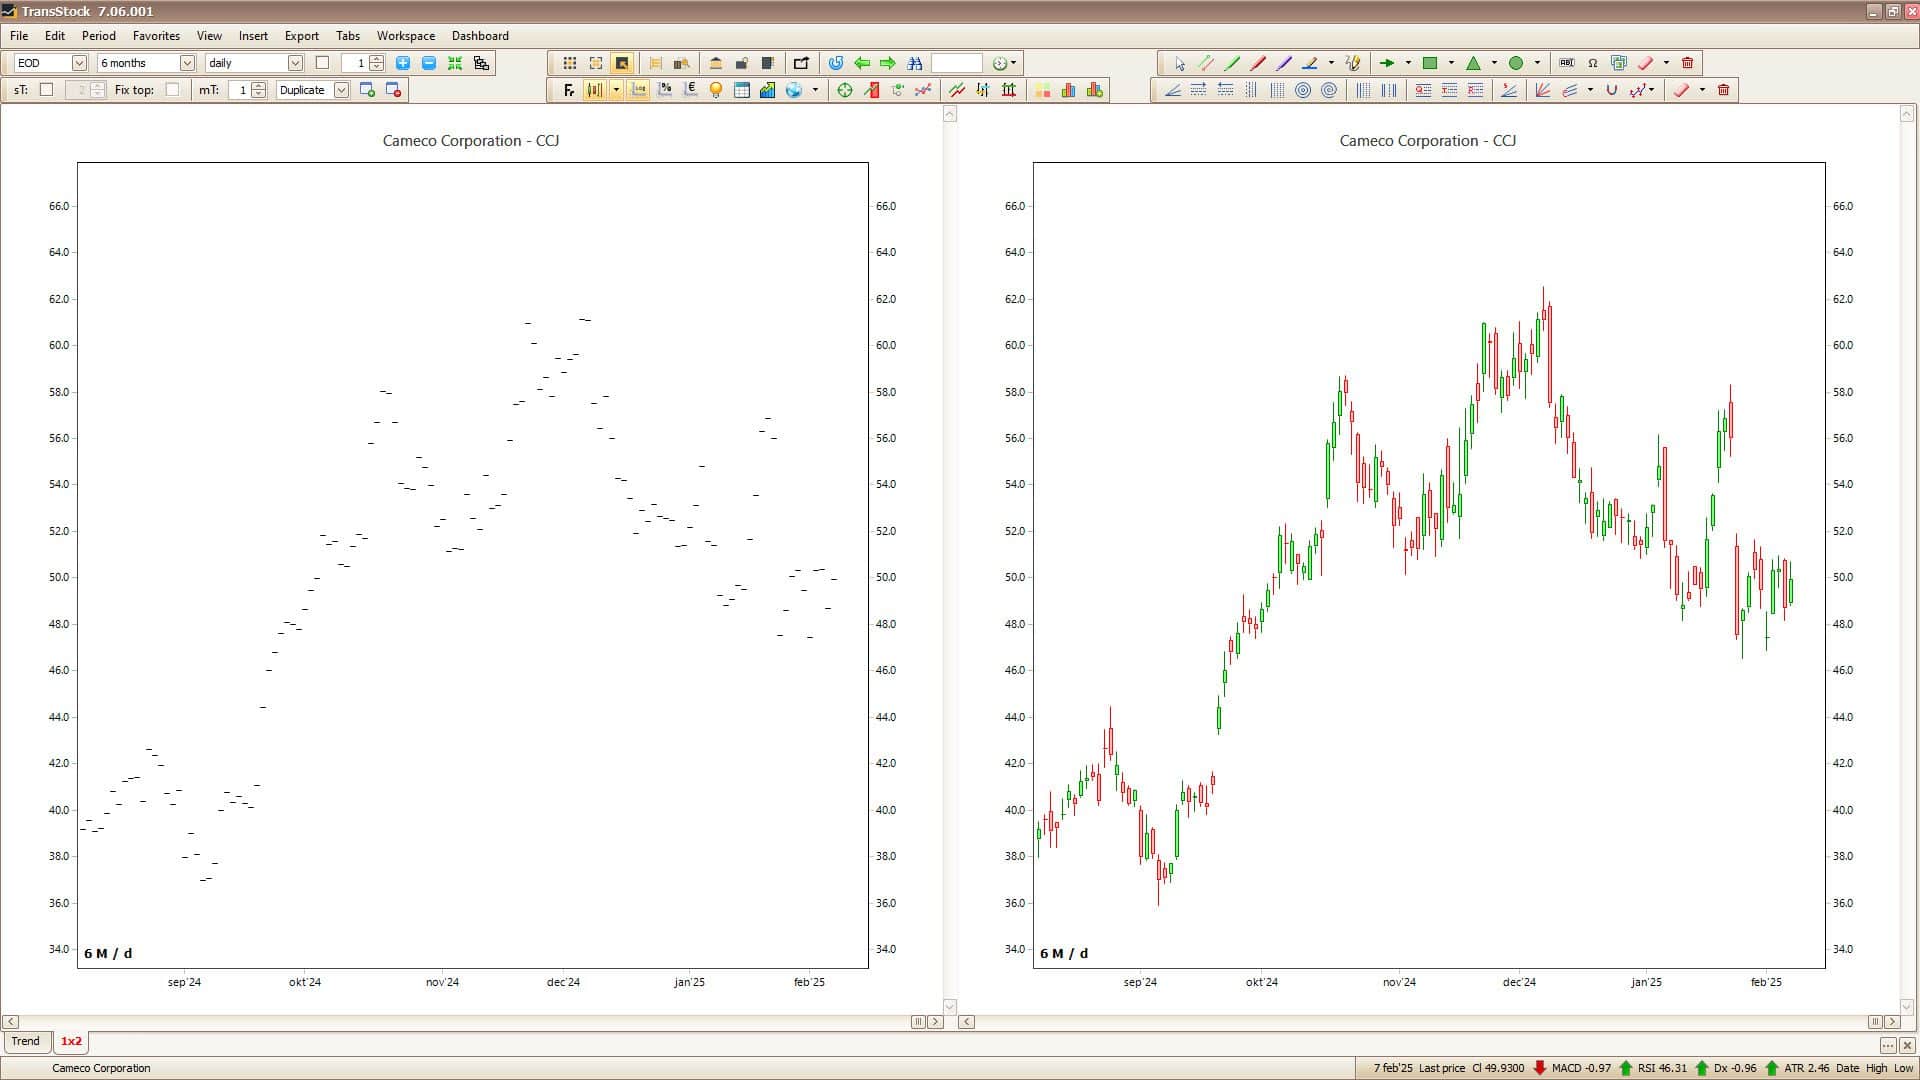
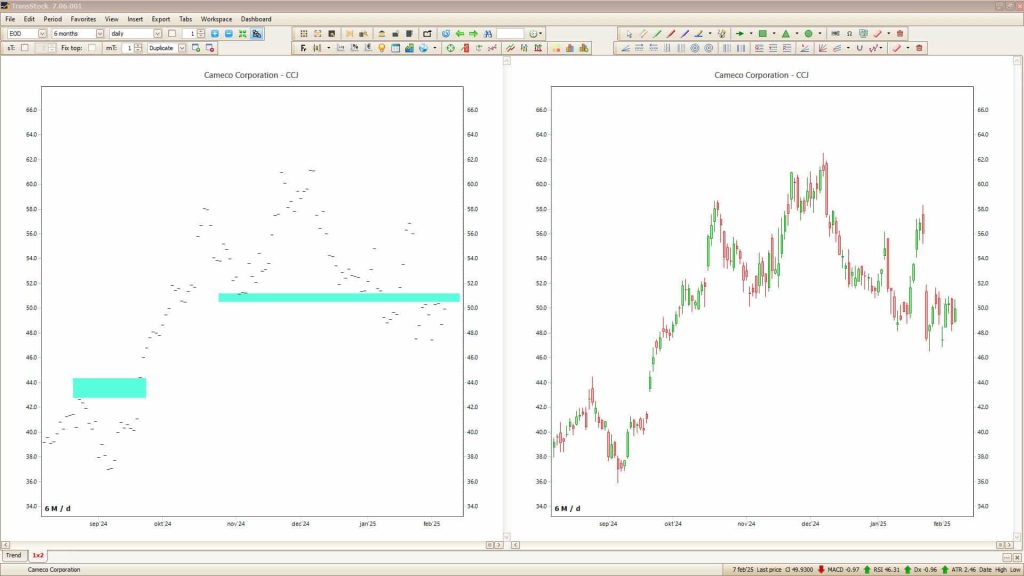
Classic candlesticks often overlap due to bodies and wicks. Close Candle reduces visual clutter, making pivot zones and breakouts more noticeable.
Williams Alligator as scan in TransTrader
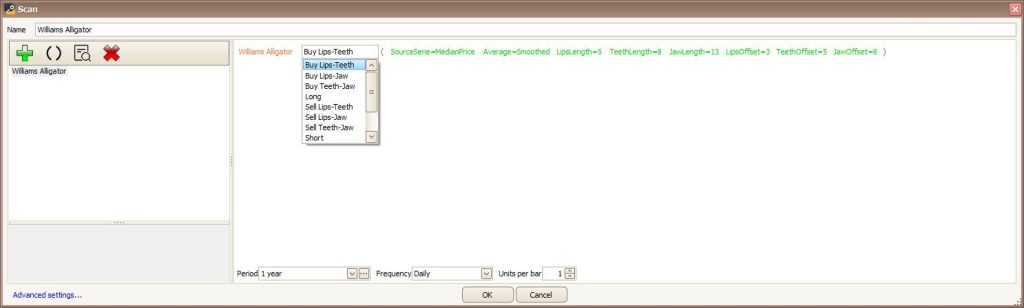
You can now search for stocks based on the Alligator balance lines (Lips, Teeth, Jaw). In TransTrader are eight conditions available:
- Buy Lips–Teeth: Lips cross upward over teeth.
- Buy Lips–Jaw: Lips cross upward above jaw.
- Buy Teeth–Jaw: Teeth cross upward above Jaw.
- Long: all balance lines rise.
- Sell Lips–Teeth: Lips cross downward under Teeth.
- Sell Lips–Jaw: Lips cross downward under Jaw.
- Sell Teeth–Jaw: Teeth cross downward under Jaw.
- Shorts: all balance lines descend.
Would you also like to benefit from the Close Candle and Williams Alligator?
Discover how TransStock helps you better assess trends and pivot points.
4,6 / 5
Disclaimer: The information on this blog is for educational and informational purposes only. It does not constitute investment advice. Investing involves risks. Always do your own research before making any financial decisions.