EMA-based horizontal zones in TransStock: faster insight into new highs and lows
1–2 mins

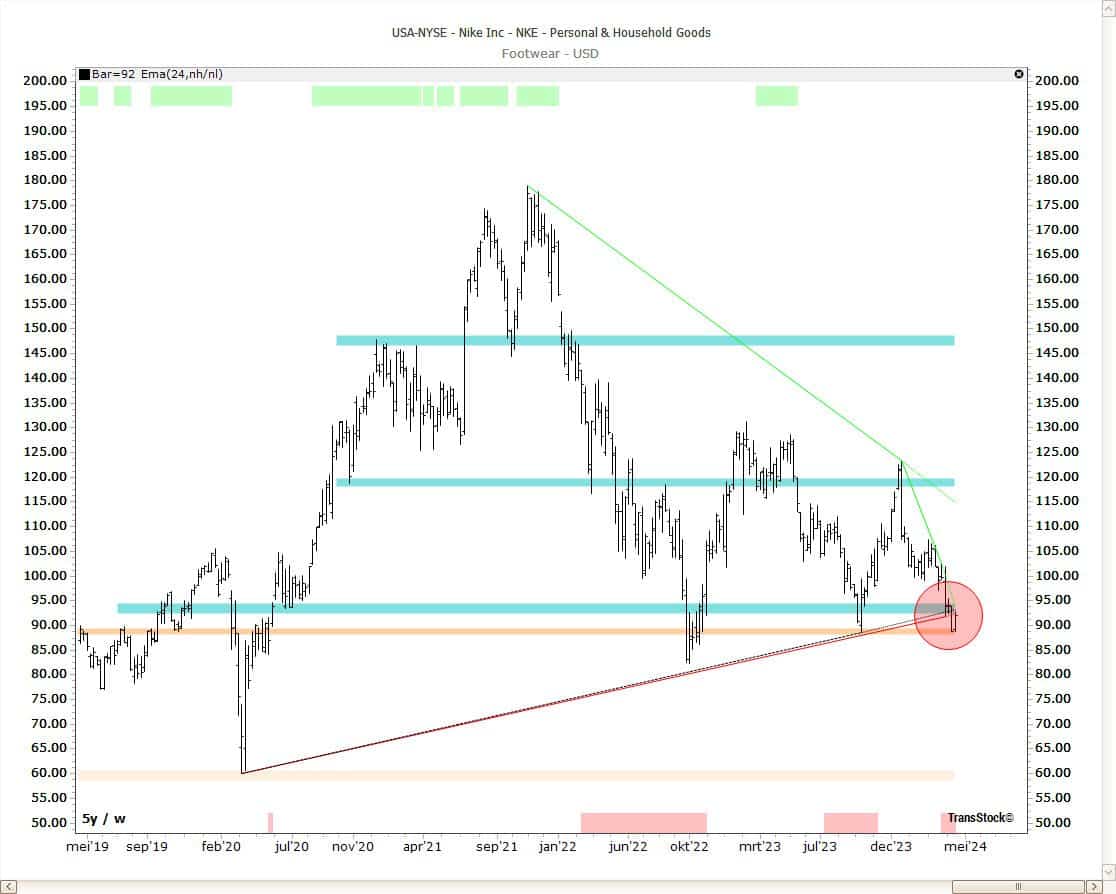

Nike stock price chart with EMA-based horizontal zones. Combined with the automatic horizontal zones and support/resistance lines, you see an interesting cluster.
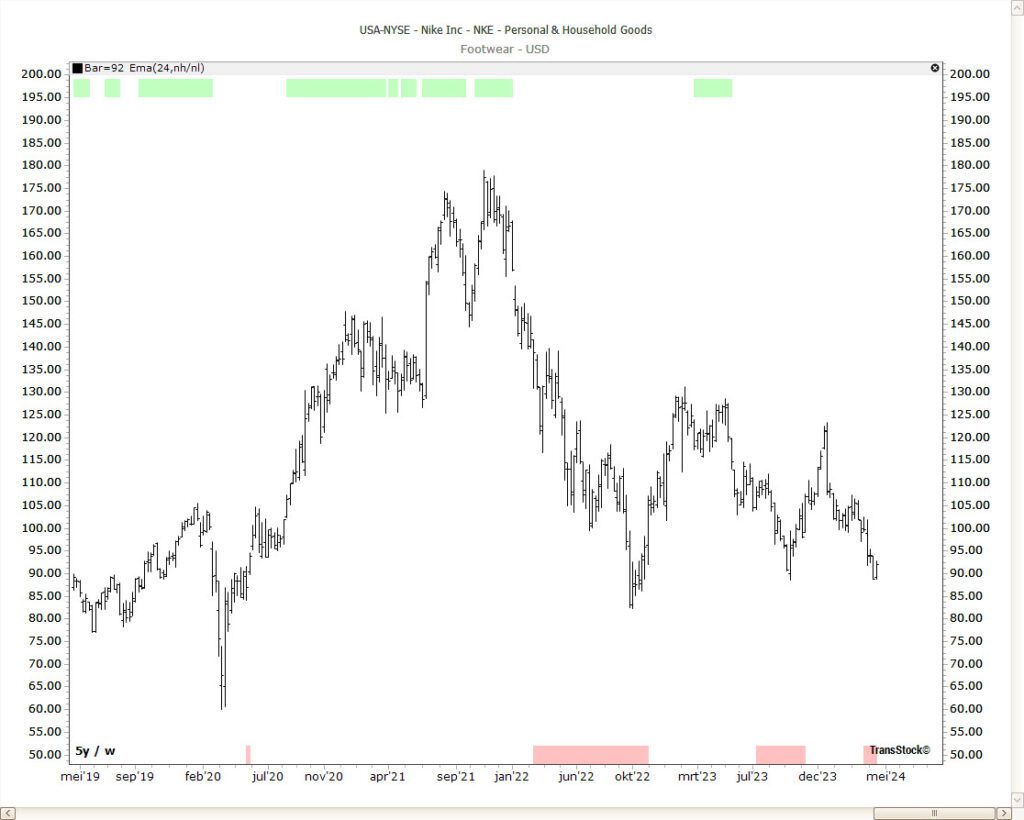
Quickly see what matters. With the EMA-based horizontal zones in TransStock you can easily recognize periods with new highs en new lowsThe chart remains easy to read, while zones and automatic support/resistance give you immediate context around pivot points.
Educational; not investment advice.
Why EMA-based horizontal zones?
- New highs/lows at a glance – green and red zones mark periods where averages are making new highs or lows.
- More context, less noise – combine with moving averages and RSI to read direction and strength without overloading your chart.
- Flexibility – period from ~24 days to several years, with adjustable sensitivity up to 95%.
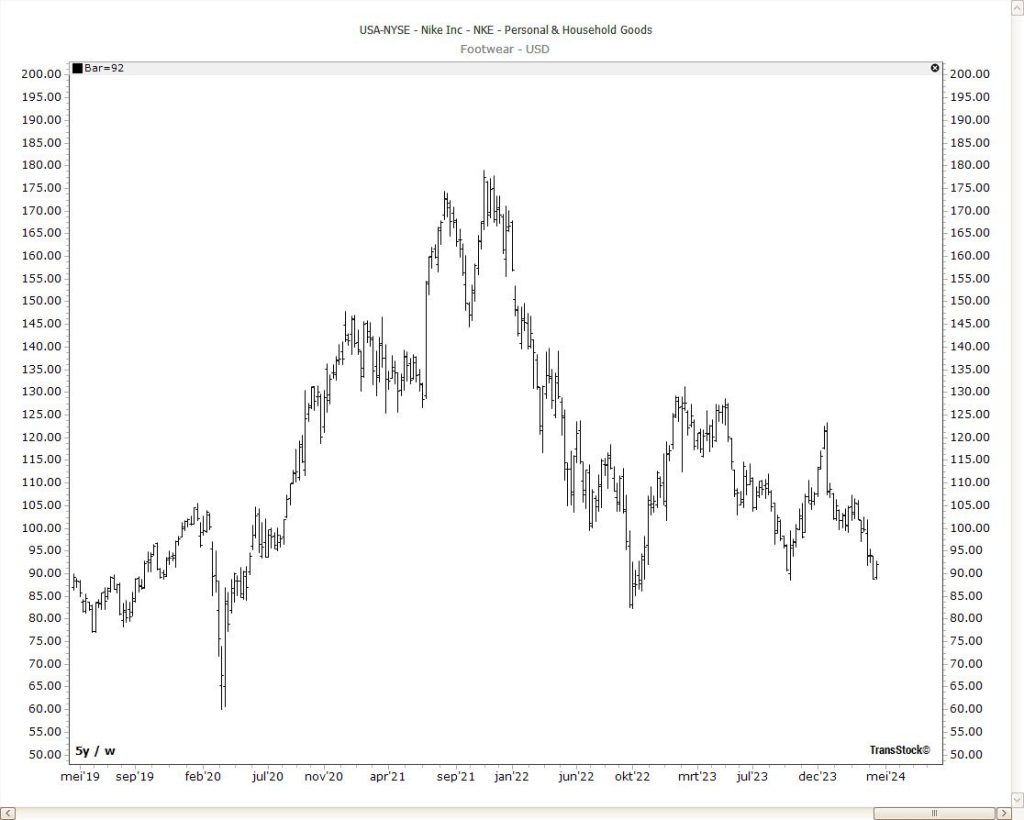
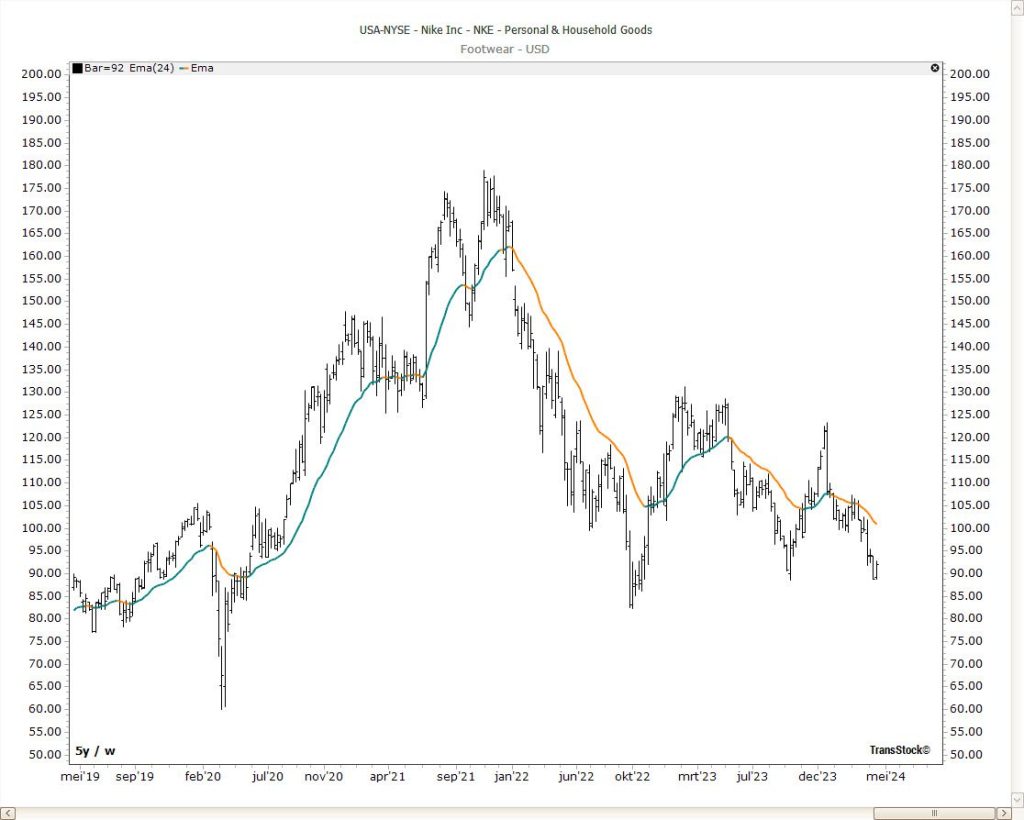
Examples (Nike, 5 years weekly)

Practical gebruik
- Activate the zones via the toolbar icon (on/off).
- Select period & sensitivity – short for active trading, long for trend/position; increase sensitivity for finer detection.
- Combine with EMA/MA and an RSI window for additional direction and momentum conformation.
- Normalize Y-axis when outliers dominate the image; this way you can read the middle group better.
Tips
- Day ↔ week: Switch timeframes to filter out noise or see details.
- Portfolio check: Green zones (new highs) can support “holding”; red zones (new lows) require extra attention.
Want to see new highs and lows faster?
Try the EMA-based horizontal zones in TransStock and work with clear, uncluttered charts—from overview to action.
★ ★ ★ ★ ★
4,6 / 5
4,6 / 5
Educational. Not investment advice.
This publication is for educational and informational purposes only. It does not constitute an invitation to buy or sell, nor does it constitute personal investment advice.