Aroon Indicator: One Crossing Tells When, Not Why—And That's Enough

Almost all indicators measure how the price moves. The Aroon indicator Meet wanneer The price recently reached a new high or a new low. That's exactly what you want to know as an investor: is this stock still making new highs, or has it lost its momentum?
Sufficient reason for a contribution about the unique Aroon indicator.
What exactly does the Aroon indicator measure?
The Aroon indicator consists of two curves, limited between 0 and 100:
- Aroon Up (green): how recently did the price set a new high within a chosen period NThe more recent, the closer to 100.
- Aroon Down (red): how recently did the price make a new low? NThe more recent, the closer to 100.
You don't need to remember formulas.
Just think: green = recent new top, red = recent new bottom.
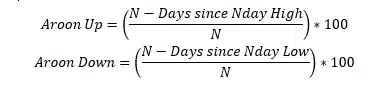
The formula below is for informational purposes only, for those who would like to check it or use it in a worksheet.
Tip: Best setting for the Aroon indicator
My preference goes to N = 55 days, a value based on Fibonacci.
Feel free to experiment with other settings and judge for yourself.
Mini explanation of the principle
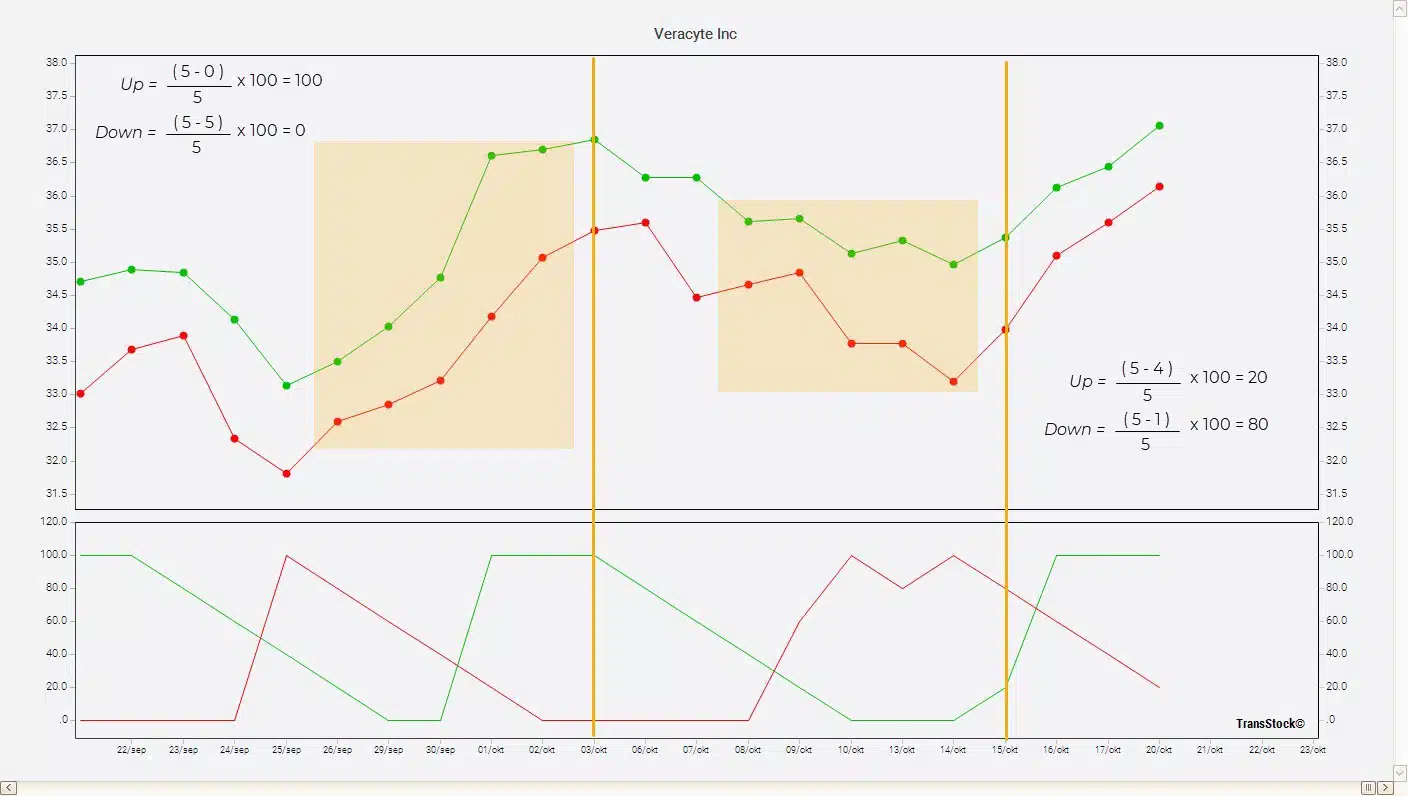
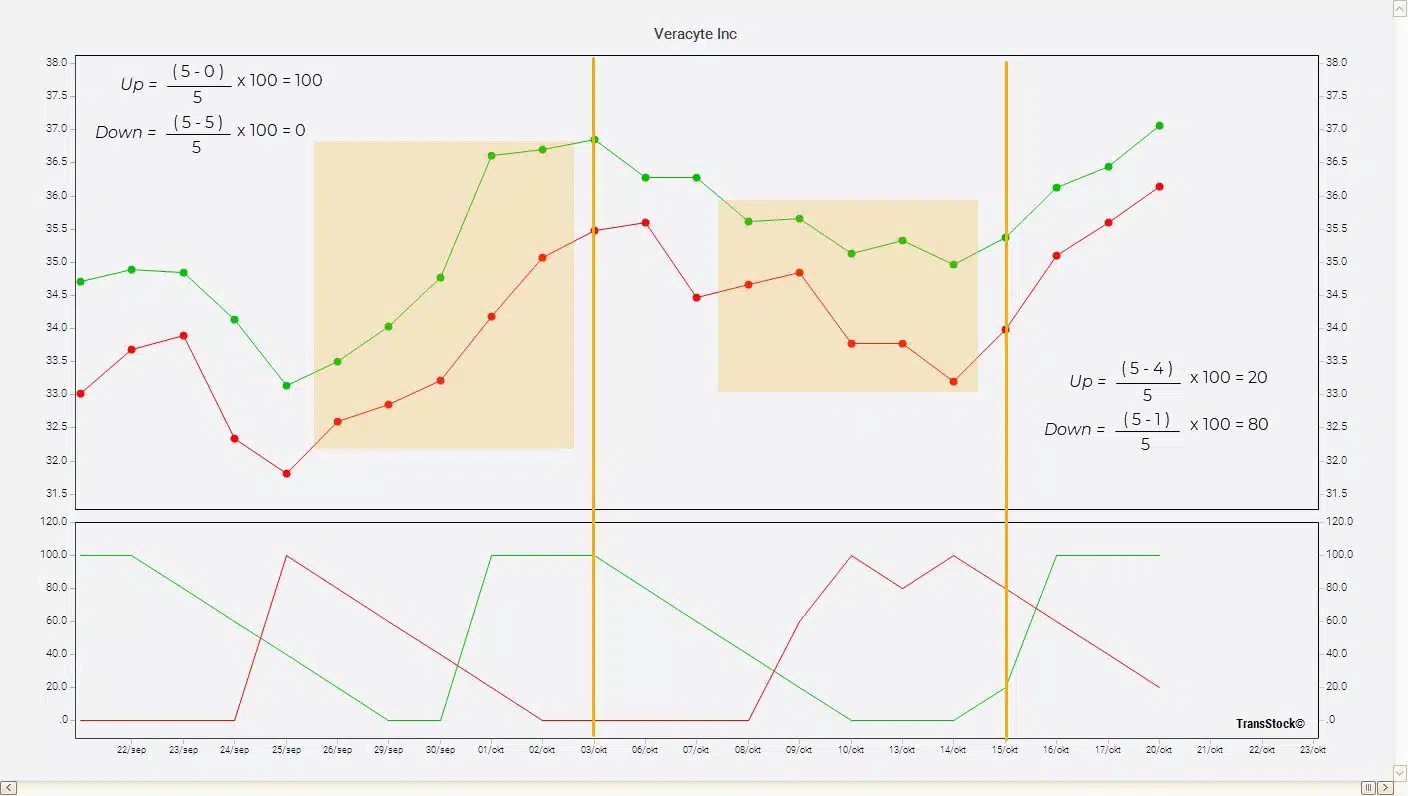
Yellow rectangle = 5-day review period.
The chart above connects the high and low prices at the top. At the bottom, you see the Aroon indicator.
For simplicity, I am working here with a period of five trading days.
On the left of the chart you can see the moment when the price just made a new high: Aroon Up = 100 en Aroon Down = 0.
To the right the price falls, a bottom approaches: Aroon Up drops en Aroon Down rises.
This way you can see at a glance what what happened recently — without counting or guessing.
Aroon indicator in practice: a tangible example
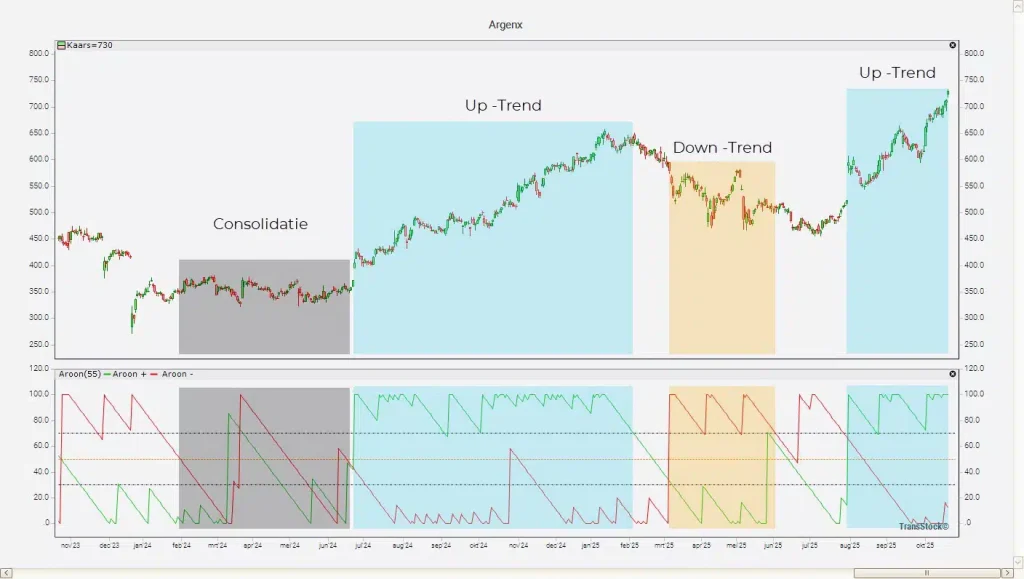
- De gray area shows a consolidation: both lines hang low or run parallel.
- In blue zone Aroon Up remains high and Aroon Down low: a healthy uptrend.
- De orange zone shows the opposite: Aroon Down remains high → downtrend.
- After a brief consolidation, Aroon Up takes over again and resumes its rise.
Trend reversal: crossing the Aroons
The crossing of Aroon Up en Aroon Down often marks the beginning of a new trend phase.
You will not receive an explanation why , but a clear signal wanneer. And that is often enough.
The different phases of the Aroon indicator
Phase 1: consolidation
- Aroon Up and Aroon Down below 50, or both lines moving parallel.
- Few new tops or bottoms are formed.
- You wait for the market to provide direction again.
Phase 2: Start of a new uptrend
- Aroon Up crosses upwards above Aroon Down.
- Aroon Up > 50: New peaks are gaining ground.
- Aroon Up = 100 while Aroon Down remains low: momentum building.
- You are considering making a first purchase.
Phase 3: Uptrend
- Aroon Up between 70 and 100 and Aroon Down between 0 and 30.
- New highs appear recently and repeatedly; bottoms are absent.
- You can hold or buy more.
How do you combine Aroon with a fundamental view?
- Filter by quality: profit growth, cash flow, debt ratio.
- Check out the trend with Aroon (day N = 55): only values with Up > 70 and Down < 30.
- Boarding at a cross where Up remains above 50, preferably together with a price breakthrough.
This is how you work systematically: first the right company, then the right trend, then the right moment.
Common Mistakes (and the Remedy)
- “Aroon Up = 100 is overbought.”
In strong trends, this often simply means: strong. As long as Aroon Down remains low, you'll hold these winners. - Choosing an N that is too small.
That makes the indicator nervous. Experiment and refine only afterward.
From signal to application
De Aroon indicator helps you determine wanneer A trend starts or weakens. In practice, this only becomes truly powerful when you combine these signals with other technical and fundamental filters.
Within the TransStock environment Such trend indicators are applied systematically, linked to quality filters and clear entry rules.
This way you avoid noise and focus on markets and shares where momentum and structure coincide.
What have we learned from this technical analysis contribution?
With the Aroon indicator you don't measure the why, but the when.
- You can see how recently new tops or bottoms are formed.
- You recognize trends faster and easier.
- You let crossbreeds decide timing.
So what have we learned? Let the crossbreeds decide…
Investing without beginner mistakes?
Want to invest without making beginner mistakes? Then read our clear guide.
learn to invest.
Aroon indicator - Short FAQ
NEWSROOM

Latest video