
Parabola tool in TransStock: identify critical zones and turning points faster



See more quickly what really matters. With Horizontal Pivots marks TransStock automatically critical tops en bottoms as support and resistance zones. You can see at a glance where prices often stop, turn, or breakout—ideal for quickly identifying opportunities and risks.
Educational; not investment advice.
What are Horizontal Pivots?
Horizontal Pivots translate important historical price levels (tops/bottoms) into stable horizontal zonesBy default, you see five zones, but you can adjust the number to your preference for a finer or coarser reading.
Why does this work in practice?
- Efficient: the system automates looking for support/resistance — less manual lines, more focus.
- Accurate: Zones are built on historical responses and therefore provide realistic references.
- Flexibility: Applicable to equities, ETFs, and indices; zones remain relevant across multiple horizons.
Switching on and off
You can set Horizontal Pivots with one click on/off route of Tools toolbarThis allows you to effortlessly switch between a "clean" graph and a graph with reference zones, depending on your question at that moment.
Case: Centerra Gold (2019–2024)
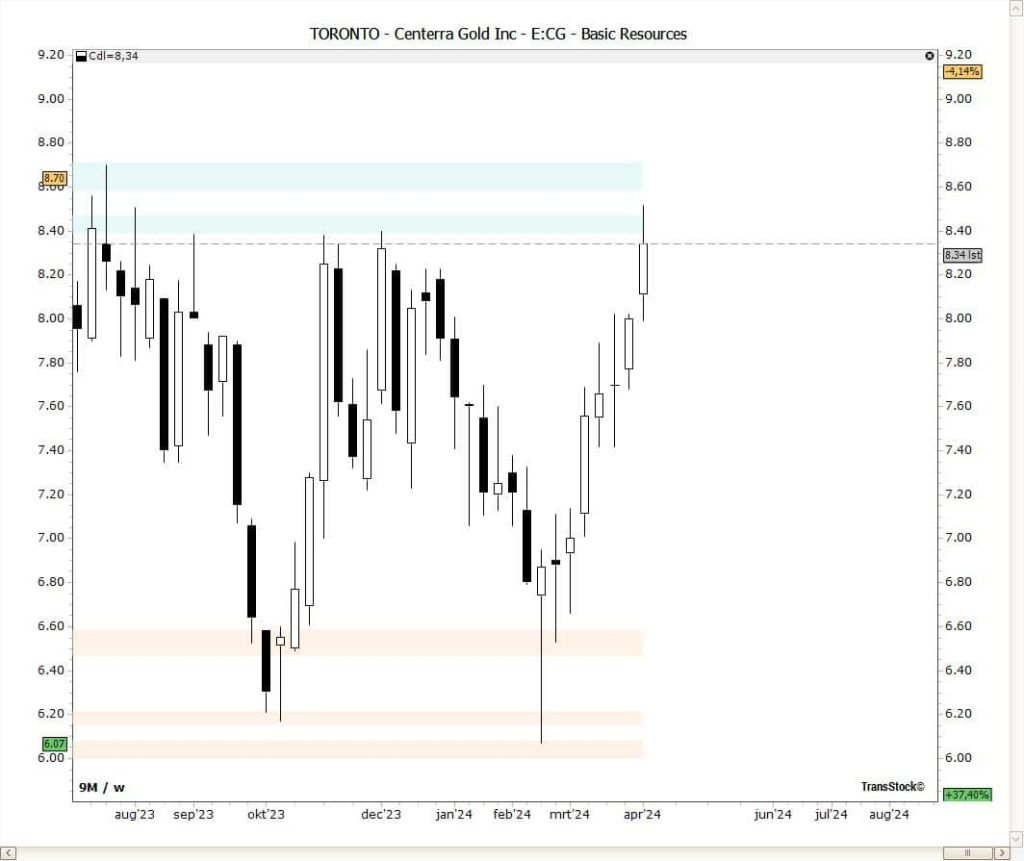
In the case study on Centerra Gold see how the same zones keep speaking — both on a 5-year-old graph as in a 9 months Snapshot. Double resistance bands (e.g., around 8,50 and 9,00) make it easy to spot obstacles and evaluate positions. This helps you avoid setups with weak technical context.
Workflow: from idea to action
- Activate Horizontal Pivots and determine the number of zones (coarse → fine).
- Read the nearest support/resistance around your instrument: where are the obstacles or “safe” retest levels?
- Consolidate with other windows (e.g. trend filter or MAs) to confirm bias.
- Plan Entry/Exit: Breakout above resistance or bounce off support determines your scenario and risk limit.
Tips
- Snapshot ↔ long horizon: Check both the short window (9 months) and the big picture (5 years) for consistent context.
- Round number ≠ guarantee: let the actual pivot zones are leading instead of psychological levels.
- Breakout validation: preferably wait for a slot above/below the zone or context signal (volume/trend) for you to decide.
Do you want to see support and resistance automatically?
Try Horizontal Pivots in TransStock and frame pivots faster — from short snapshot to 5-year history.
4,6 / 5