TopScope in TransStock: multi-period stock comparison in one chart

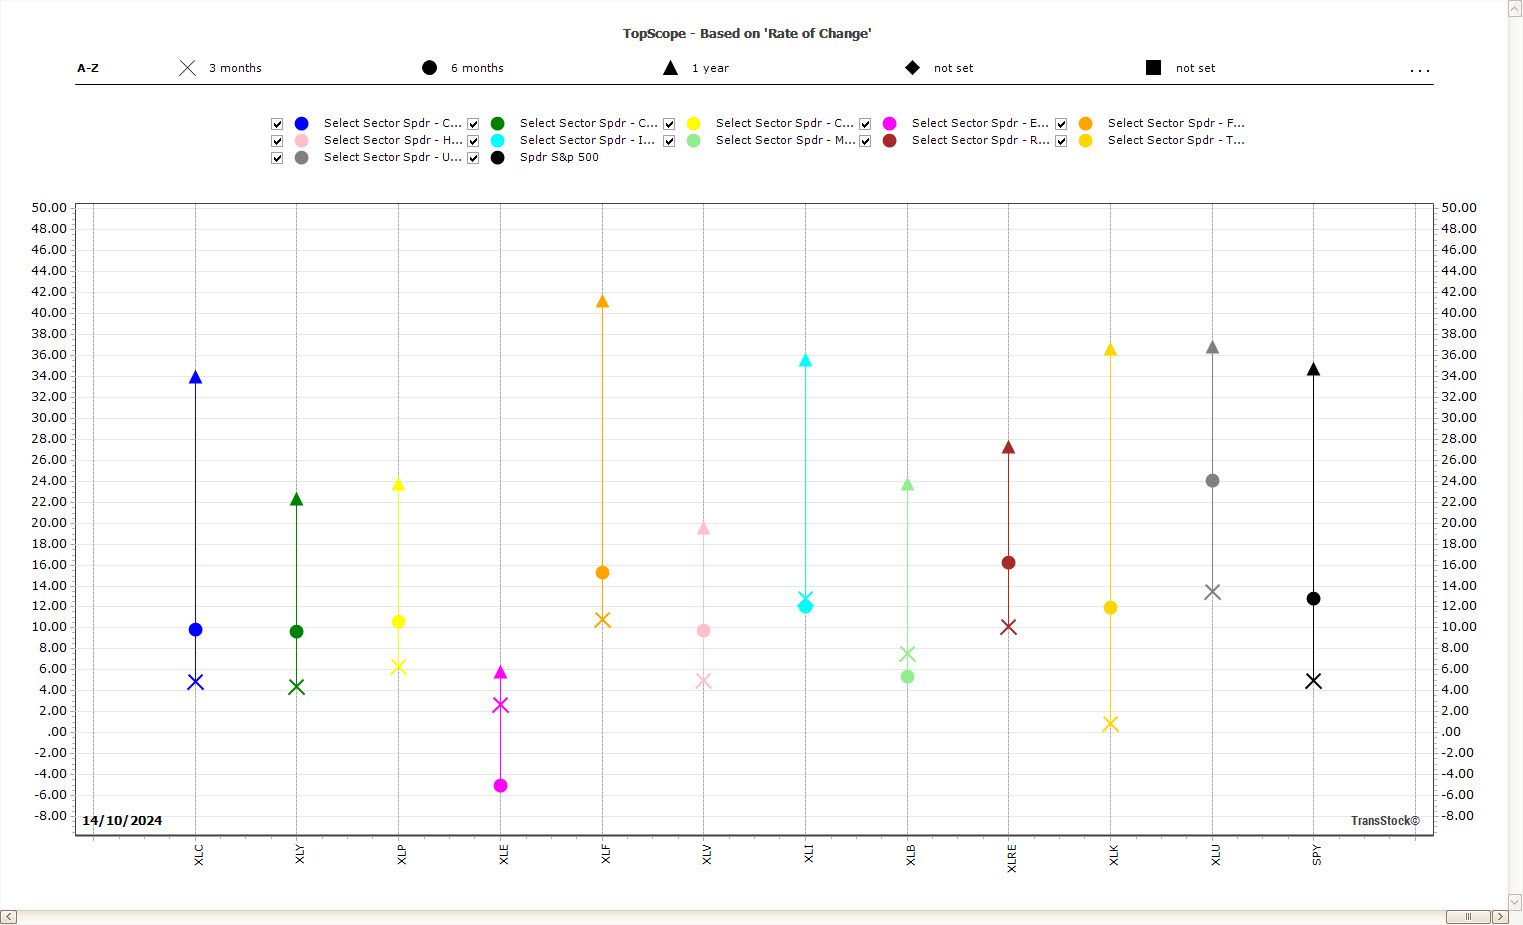


Fewer tabs, faster insight. With TopScope Compare multiple stocks over different periods in a single graph. You can see the evolution of each stock over time, optionally sort the X-axis by performance, and normalize the Y-axis for a balanced view.
Why TopScope?
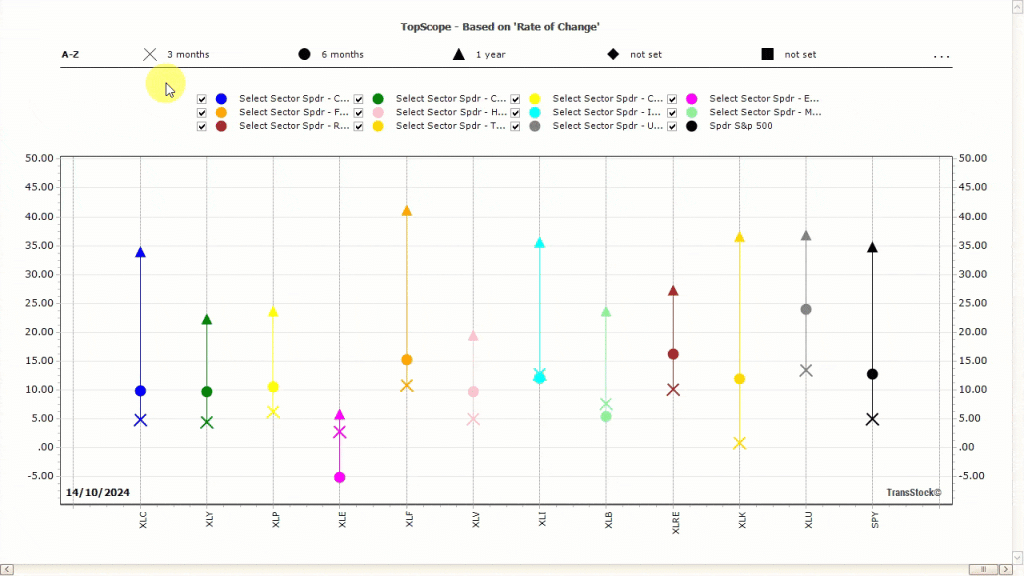
- One look, multiple periods – per share a vertical line with symbols (e.g. diagonal cross or circle) for 3–5 periods.
- Arrangement of your choice – X-axis alphabetically or sort by performance over the chosen period to show winners and losers.
- Balanced Y-axis – hide extremes/normalize to reduce outliers and make the middle group easier to read.
Example: Sector SPDR ETFs
In the example, you compare 12 stocks (11 sector ETFs and SPY as a reference). The length of the vertical line shows the magnitude of the movement; the order and position of the symbols reveal direction and strength over time. This allows you to quickly spot relative strength/weakness and potential reversals that deserve closer attention.
Activate and configure TopScope
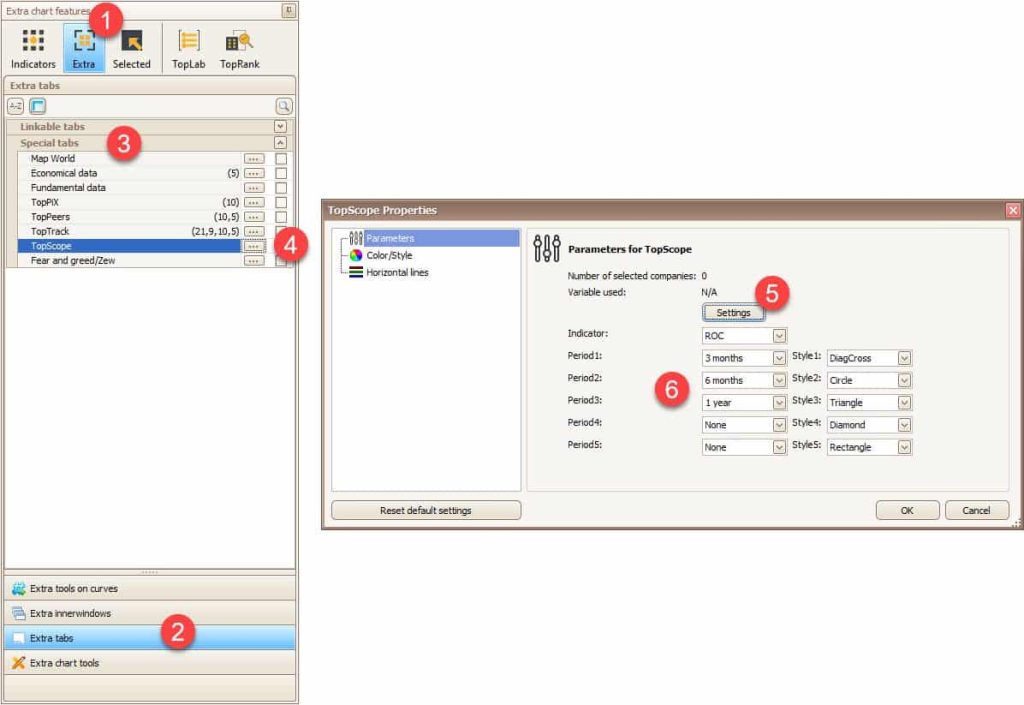
- Turn on indicator - Indicators Explorer → Extra (1) → Extra tabs (2) → Special tabs (3) → Finch TopScope on (4).
- Select parameters - via Settings add titles (5), periods (3–5) and set symbol style (6).
- Reading aid – turn on normalization to hide extremes; use the X-axis sorting to see strongest/weakest at a glance.
Practical reading tips
- Long line = large movement (volatility/strength) in the selected periods.
- Symbol progression (e.g. from low to high) = upward evolution over time; reversed in case of weakness.
- Check multiple periods to see a consistent story and avoid noise.
Want to see winners and losers at a glance?
Try TopScope in TransStock and compare multiple stocks over 3–5 periods without chart overload.
4,6 / 5
Disclaimer: The information on this blog is for educational and informational purposes only. It does not constitute investment advice. Investing involves risks. Always do your own research before making any financial decisions.