MARKET ANALYSIS
From sleeping to hunting: discover the power of the Williams Alligator

PART
In the world of technical analysis, indicators play a crucial role: they help investors make informed decisions. One of those indicators, the Alligator indicatorstands out for its unique approach to identifying trends. The Alligator indicator, developed by Bill Williams, combines simplicity with in-depth analysis, making it increasingly popular with both novice and experienced traders.
Sufficient reason for a contribution about the unique Alligator indicator.
What is the Alligator Indicator?
The Alligator indicator is a trend following tool and helps identify the start, continuation, and end of a trend.
The name comes from the visual resemblance of its components to the jaws, teeth, and lips of an alligator. The indicator's premise is simple: the market is like an alligator that spends most of its time sleeping. When it wakes up, it begins to hunt, signaling the start of a trend.
Understanding whether the alligator is “sleeping” or “hunting” helps investors position themselves effectively.
What are the parts of the Alligator indicator
The Alligator indicator consists of three smooth moving averages:
- The Jaw (Blue Line):
A 13-day moving average, shifted 8 days into the future. It shows the long-term trend.
- The teeth (red line):
An 8-day moving average, shifted 5 days into the future.
Indicates the medium-term trend.
- The Lips (Green Line):
An 5-day moving average, shifted 3 days into the future.
Shows the short-term trend.
How to Interpret the Alligator Indicator
The indicator is designed to identify three key market conditions:
- Sleeping Alligator (Consolidation)
The three lines are close together or intertwined.
This indicates a lack of strong market movement and suggests a consolidation phase.
Investors are advised to wait at this stage as the market has not yet determined a direction.
- Awakened Alligator (Trend Rise)
The lines begin to diverge, with the green line showing the way.
This is the signal that the market is starting a trend.
The direction of the trend (up or down) is determined by the position of the green line relative to the other two lines.
- Eating alligator (Strong trend)
The lines are well separated and moving in the same direction.
This indicates a strong trend and investors benefit the most from this phase.
Building positions in the direction of the trend is possible.
- Saturated Alligator (Trend Ends)
The lines are starting to converge again, indicating the end of the trend.
This is the time to reduce positions and prepare for a reversal.
The Fibonacci series
The Fibonacci series is a sequence of numbers that often appears in nature, mathematics, and, surprisingly, also in financial markets. This series begins with 0 and 1, with each subsequent number being the sum of the two preceding numbers: 0, 1, 1, 2, 3, 5, 8, 13, 21, and so on.
In technical analysis, the Fibonacci series is often used to identify natural relationships and patterns in price movements. The chosen periods of 5, 8, and 13, described above, are therefore based on the Fibonacci series and form a core component of the Williams Alligator. For less volatile trend determination, you could use, for example, 21, 34, and 55 days.
Why Fibonacci?
The power of Fibonacci lies in its natural harmony. Because the series and the resulting ratios, such as 61.8% and 38.2%, often appear in price structures, they offer a methodical and proven way to analyze market dynamics. By basing settings on this series, indicators are better aligned with the market, resulting in more accurate and reliable signals.
Real-world example: CMC Markets (London)
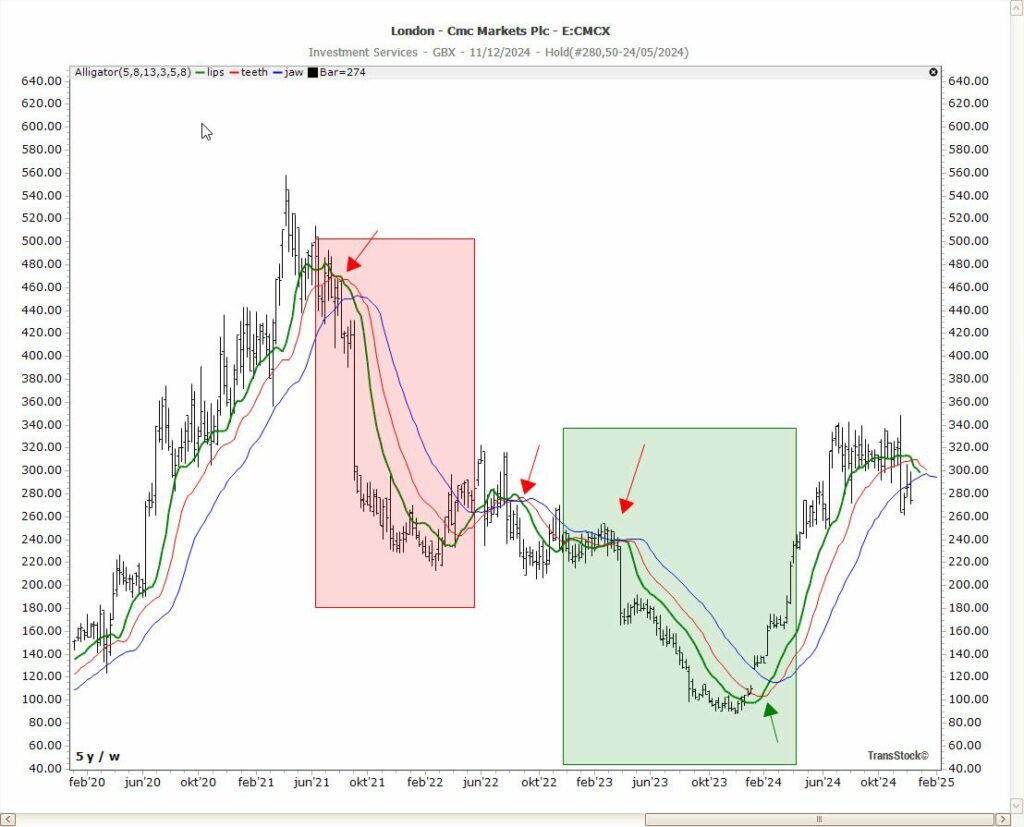
De CMC Markets chart shows you how the Williams Alligator indicator identifies clear market trends along with entry and exit points.
Trend identification using the Alligator
- Consolidation (Sleeping Alligator):
After a significant decline, the second half of 2021 saw a period of consolidation followed by a slight recovery. In October 2022, we moved further down, and in early 2023, the Alligator lines (green lips, red teeth, and blue jaw) converged. This marked another period of indecision and consolidation. The Alligator was "sleeping," indicating that investors should remain cautious and wait for the next trend to emerge.
- Emergence of a Downtrend (Awakening Alligator):
In mid-2023, the green lip line crosses the red teeth and blue jaw lines downward. That is the beginning of a downtrend.
As the lines begin to diverge, the Alligator is 'awake' and confirms the downward movement in the market.
- Strong Downtrend (Eating Alligator):
During the second half of 2023, the Alligator lines remain widely spread, showing a strong and sustained downtrend.
This is the Alligator “feeding,” a phase where traders can confidently hold short positions and avoid buying (long).
- Trend Weakening (Saturated Alligator):
In early 2024, the Alligator lines will converge again: the end of the downtrend and a possible reversal or consolidation.
This is the Alligator "falling asleep," signaling investors to close short positions and prepare for the next trend.
Ready to see how Snowflake works?
The Alligator indicator is a powerful and simple tool for trend identification. By understanding its components and how to interpret them, you'll better navigate market movements and avoid holding long-term positions during consolidations that yield little or no return.
If you use the indicator in combination with other technical tools, such as horizontal zones or quadrant analysis (see TA Day Ghent 2024), you will significantly increase your chances of success.
Williams Alligator - Short FAQ
What is the Williams Alligator indicator?
The Williams Alligator is a technical indicator created by Bill Williams that uses three smoothed moving averages — the “Jaw,” “Teeth,” and “Lips” — to signal when the market is trending or consolidating.
How do I interpret the three lines of the Alligator?
When the lines (Jaw, Teeth, Lips) intersect, the Alligator is "sleeping" (market without a trend). When they diverge, it "awakens" → trend formation. When they move further apart, the Alligator is "eating" (trend active). Convergence → trend weakening.
Which indicators should I combine the Alligator with for more reliable signals?
Many traders combine Alligator with RSI, MACD, fractals, or volume because the Alligator only works in trending periods; in sideways markets, it can give false signals.
Is this financial advice?
No. This information is for educational purposes only. You should base any investment or trading decisions on your own analysis or professional advice.
Disclaimer: The information on this blog is for educational and informational purposes only. It does not constitute investment advice. Investing involves risks. Always do your own research before making any financial decisions.